Today people leave digital footprint in every aspect of their lives and unsurprisingly term “data science” is heard more and more often. Shops use purchase history to understand their client base, make personalised recommendations or plan advertising budget (data science in retail and marketing); banks develop state of the art systems to assign credit rating to individuals and companies, predict return on capital and default rates (data science in consumer credit and finance); healthcare organisations use data to track spread of a disease, identify vulnerable subgroups and plan medical interventions (data science medicine and epidemiology).
This means there is a high chance a young person with an interest in science, math or programming will apply data science techniques in her or his future career.
Our 10-session course aims to give a taste of what it means to analyse the data and how to use Python to compute and visualise the findings. We will cover the terms mean, median, min, max, standard deviation, risk, relative ratios and apply to different sets of data. Children will be expected to complete short home assignments and present a project on which we will work together throughout the course. No prior knowledge of statistics or programming is needed, however solid understanding of the school curriculum is expected.
Children’s age: 12+
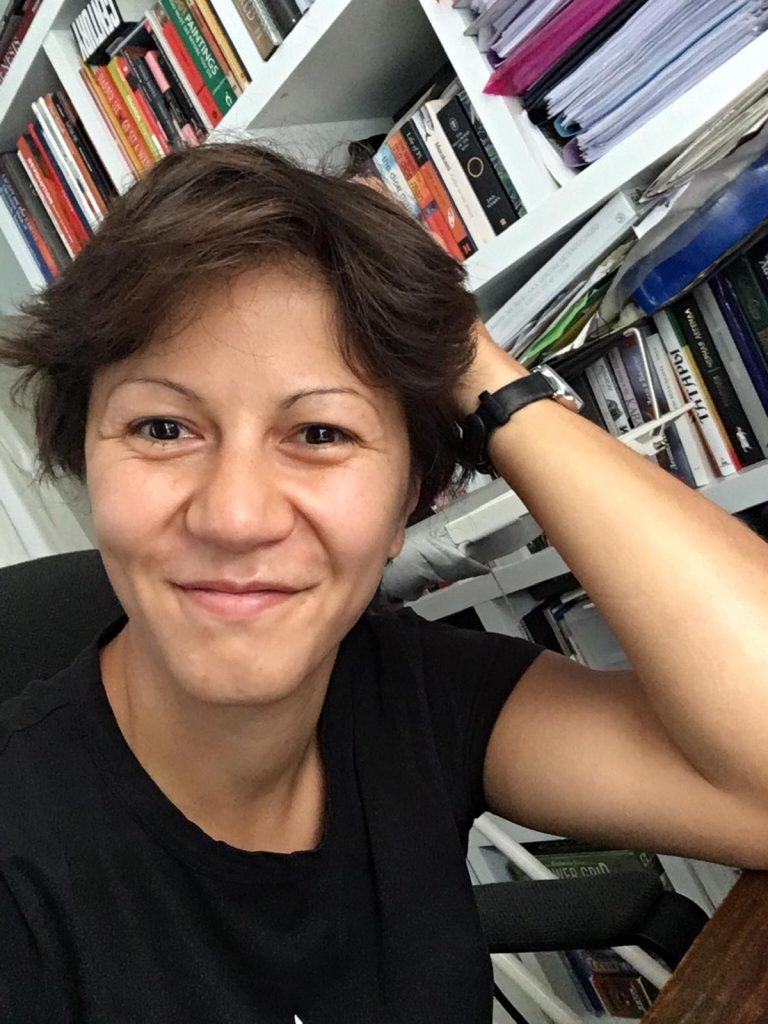
Teacher: Diana Shamsutdinova
I studied mathematics at Moscow State University about 15 years ago and since then my professional life has been centered around numbers and statistics. Right after the university, I worked as an actuary in an insurance company and then moved to investment banking to be a derivatives trader for more than a decade. Lately I developed an interest in psychology, completed MSc in Neuroscience and Psychology of Mental Heath and am mow working on my PhD project in biostatistics in Kings College London.
Teaching has long been one of my side projects: in the student years I tutored mathematics and physics privately and in summer schools, delivered various seminars while at the bank and extra math lessons to my kids and their classmates. It is always a pleasure to see how pupils uncover the beauty of logical reasoning and learn new tools for deeper understanding of things around us.
Curriculum:
Lesson 1-2. What is data? What can it be, types of the data. How to get the data? Data collection and its challenges. Getting data for individual projects, loading datasets to Python.
Lesson 3-4. Getting hands dirty and getting to know your data. Looking at each variable, calculating min, max, mean, median, standard deviation, graphs in Python. Interpretation: understanding what these numbers tell us.
Lesson 5-6. Move to understanding relationships between the numbers. How to check if one set of numbers is connected to another? Concept of correlation, independence of relative size. Practical examples, checking different data sets, calculating correlation and checking how it looks on a scatter plot.
Lesson 7-8. Linear regression, dependence of one factor on many others. What it is, how to plot. Examples. Start working on individual projects.
Lesson 9-10. Discussing and presenting individual projects.